Our company is 100% focused on Business Intelligence solutions. 
Since 2002 we closely work with Microsoft EMEA in Europe and IBM Cognos in France.
|
We are experts in three fields:
(building exclusive graphics for our customers, for visual communication
(advanced Olap decision support systems, optimized for simulations, planning
(Master Data Management: data quality and shared analytical dimensions).
|
 |
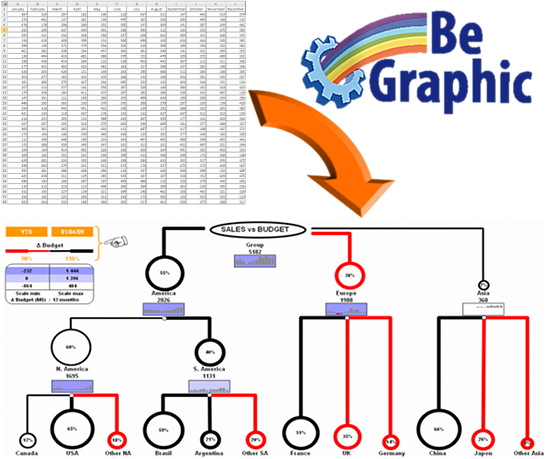
BeGraphic Story
BeGraphic software is entirely built by our R&D department. This addin for Microsoft Office provides the largest collection of data-driven professional-looking charts and diagrams. We decided to develop this software in DotNet for our customers who asked for a tool:
- Innovative charts (BeGraphic is so flexible that users can customize their own graphics)
- Data-driven graphics (reusable every month, only requiring to get fresh data)
- Easy to use (inside Excel & PowerPoint, without macros or programming language).
Many executives asked us new data visualization, ready to use in Microsoft Office, in order to convince their audience.
Here is what these Marketing people, Controllers, Consulting Companies or Sales VP asked us:
- Revenue reporting: wanting to show real borders of the sales territory on a custom map
- Needing help to make precise corporate PowerPoint presentations
- Diffuse and automate their own matric model
- Board meetings: Getting bored of the standard charts
- Media relations: Visual story-telling the company business
- Info-graphics: Communicate with meaningful diagrams
Why data visualization become so crucial
- It's nearly impossible to communicate today without using shapes to symbolize various types of relationships and their interactions.
- The key challenge of reporting is not just making information available, but transferring the knowledge contained on it.
Fresh new visualizations made with BeGraphic are a clever way to communicate information. - Nowadays the amount of information is so dramatically increasing that as an information densifier, BeGraphic is a must-have.
- With information complexity's growth, data understanding often decreases. The dynamic diagrams made with BeGraphic become crucial
to explain links and cause-effect relationships.
Self design your own data visualization

Added to Microsoft Office (Excel & PowerPoint, from 2000 to 2010 versions) as an add-in menu, BeGraphic is used in a familiar environment... event allowing to mix its advanced data visualization with average charts.
Easy to use, BeGraphic allows both a simplified use to animate individual shapes, and an advanced use to drive all parameters needed to animate a dynamic diagram / InfoGraphics / innovative chart (e.g. : cascade chart / waterfall chart, Sankey chart, mekko chart, DuPont chart, Strategy map from Balanced Scorecard methodology, tree map, heat map, parallel coordinates, Ishikawa diagram...).
Multi-users oriented, BeGraphic's presentations are easily pushed to other users
(not having BeGraphic) who will be able to see and show your data visualization
done with BeGraphic.
Secure charts : without the BeGraphic software, your work cannot be changed anymore,
preventing modification of used information.