BeGraphic empowers the visual impact of your presentation
BeGraphic transforms
any picture, image, shape, drawing, sketch, outline, blank map
into a new type of chart, fully dynamic (cell-driven)
inside Excel or PowerPoint.
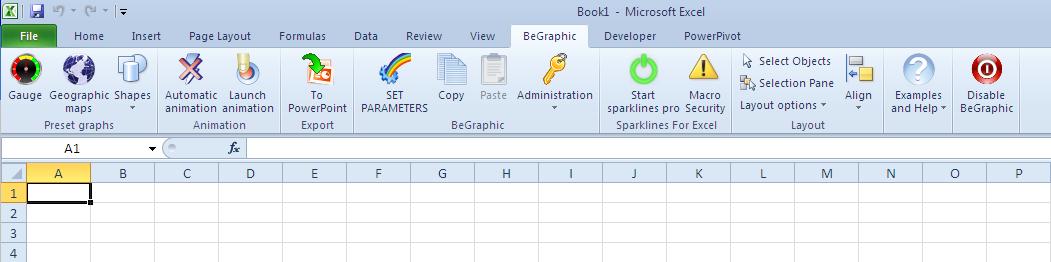
BeGraphic is so easy-to-handle that you can design any innovative chart in five seconds (changing according to Excel cell contents). Actually BeGraphic's settings are done inside Microsoft Office, as any charting function you are used to in Excel or PowerPoint.
In few minutes, you are able to build a new data visualization with any custom image (competitors' logo, managers' picture, product outline, custom sales territory) that can't be found in no other graphing tools. Then every month, your assistant can load new data and launch BeGraphic to update all information graphics, showing such a professional visual impact.
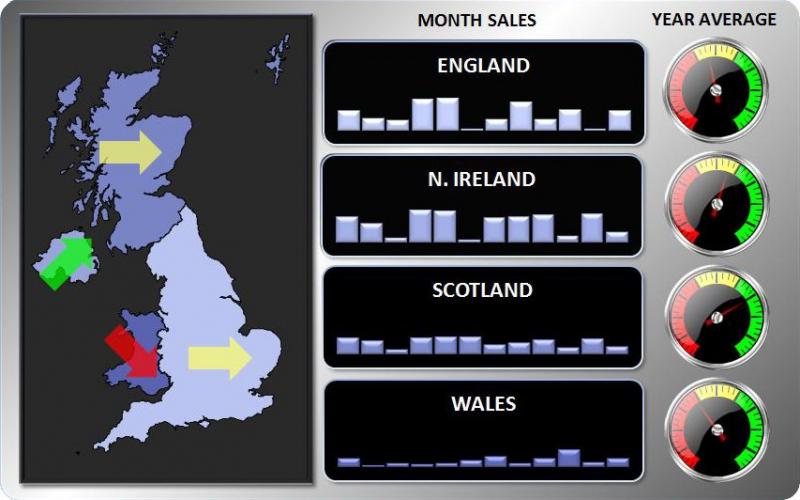
Now you are able to create new types of charts, astonishing data visualization, dynamic diagrams, home-made maps, business graphics, and infographics... just inside Microsoft Office.
Looking for new graphics?
Now you can even build your custom chart (without macro or programming language)!
BeGraphic is the easiest solution to build almost any chart, even your custom one, delivering the maximum impact to convince your audience. This is only possible with BeGraphic because it allows you to use:
the perfect custom picture dedicated to your needs (e.g.: competitors' logo, your factory plan, specific product picture, ultimate photo...),
dynamically driven by your Excel data, without any macro.
With BeGraphic you can quickly link shapes to data, in order to create dynamic infographics and innovative charts.
Watch the following video to see how BeGraphic is easy-to-handle.
The secret of BeGraphic
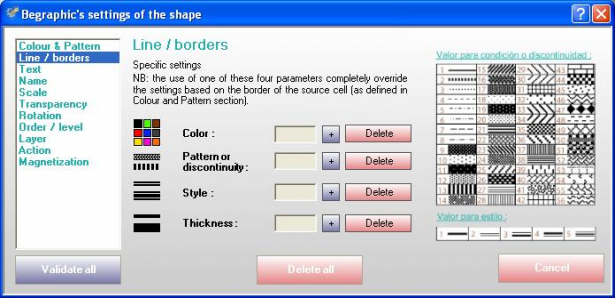
The secret of BeGraphic is to pilot every feature of a picture (height, width, color...) just with cells content (number + format).
If you use color-coding by applying "conditional formatting" (very useful Excel function), you won't have to change the color of your alert.
BeGraphic will do it for you! Use Excel conditional formatting on the source cell, then you will understand BeGraphic's way of working:
BeGraphic copies the content of the selected cells to graphics, transforming them into cell-driven statistical charts. Got it? Think cell!
examples of data visualizations in powerpoint: free PowerPoint maps, PowerPoint Templates plans, download PowerPoint free maps, ppt templates, download editable maps for presentations, country clickable map, countries, federal, state, province, county, counties, territories, area, part, sectors, borders, boundaries, ambit, editable, administrative, districts, cities, your, locations, headquarters, sales, local, planning, analyses, with, these, digital, maps, powerpoint, template, business map, marketing map for powerpoint, free maps for presentations, Editable Digital Maps, Vector, PowerPoint Maps, Illustrator, Flash, Editable PowerPoint Maps, Digital Vector Maps, Illustrator Maps, Flash Maps, PDF Maps, PowerPoint Templates and other Presentation Solutions - Digital Vector Maps, Editable USA maps, Downloadable Maps, State Vector Maps for PowerPoint Presentations, Web Development, Desktop Publishing, Illustrator Maps, Flash Maps, PowerPoint Presentations PPT Templates USA Maps, US State Maps, State Map, Digital State Maps, US Counties, PowerPoint Maps, Editable Presentation Maps, free digital vector maps, interactive flash maps, free united states maps, illustrator maps, editable digital maps vector powerpoint maps illustrator flash, congressional maps, flash maps, map wizard, continents, powerpoint templates, powerpoint maps,world maps, editable digital maps vector powerpoint maps, illustrator flash, royalty-free digital maps, digital map collections, powerpoint backgrounds, powerpoint graphics, country maps, clickable united states maps, state maps digital vector powerpoint flash and illustrator format, clickable website maps, city county databases, powerpoint map collection, maps for powerpoint, pdf map,PowerPoint Presentations PPT Templates USA Maps, US State Maps, State Map, Digital State Maps, US Counties, PowerPoint Maps, Editable Presentation Maps, Editable PowerPoint Maps, Digital Vector Maps, Illustrator Maps, Flash Maps, PDF Maps, PowerPoint Templates and other Presentation Solutions - Digital Vector Maps, Editable USA maps, Downloadable Maps, State Vector Maps for PowerPoint Presentations, Web Development, Publishing, Illustrator, Editable Digital Maps, Vector, Flash digital vector maps, world map in Powerpoint, earth map in excel, europe free map, india editable map in powerpoint, country maps, powerpoint maps, interactive flash maps, powerpoint map collection, united states maps, powerpoint templates, flash maps, new jersey state maps, nebraska state maps, colorado state maps, north america, mississippi state maps, congressional maps, ireland map, south carolina state map, canada editable map, south dakota state maps africa map, maine state map, scotland editable map, florida state map, wyoming state map, israel editable map, asia map, portugal map, michigan state map, graphic resources maps, editable digital maps vector powerpoint maps illustrator flash, south africa map, usa editable map, connecticut state map for powerpoint, state maps digital vector powerpoint flash and illustrator format, idaho state maps, washington state maps, utah state maps, japan editable map, rhode island state maps, arkansas state maps, oklahoma state maps, venezuela, taiwan, georgia state maps, massachusetts state maps, france editable map, argentina free map, all u.s 50 individual state flash maps, greece free map, poland free map, virgin island free maps, alaska state maps, alabama state maps, finland free map, free map downloads, united arab emirates, sweden editable map, pdf maps, oregon state maps, north carolina state maps, illustrator maps, mexico free map, northern ireland, denmark free map, clickable united states maps, austria editable map, download free powerpoint template backgrounds, saudia arabia free map, minnesota state maps, europe free map, pennsylvania state maps, russia free map, india free map, turkey editable map, australia free map, italy free map, spain free map, texas state maps, louisiana state maps, new mexico state maps, virginia state maps, ohio state maps, powerpoint backgrounds, norway free map, germany free map, continent editable maps, maps for powerpoint, free maps for powerpoint, belgium map for powerpoint, us maps, editable indiana state maps, lebanon free map, new zealand free map, free website maps, brazil map for powerpoint, england free map, pakistan free map, north dakota state maps, puerto rico free maps, north korea free map, tennessee state maps for powerpoint, illinois state maps, digital map collections, wisconsin state maps, california state free maps, new york state maps, free map collection, missouri state maps, vermont state maps, clickable website maps, clikable free map for powerpoint, netherlands free map, iraq editable map, china free map for powerpoint, cuba editable map, south america free map, nevada state maps, iran free map, new hampshire state maps, powerpoint graphics, switzerland free map, indonesia free map, egypt map for powerpoint, kentucky state maps, south korea free map, arizona state maps, iowa state maps, city county list, afghanistan free map, west virginia state maps, continents free map for powerpoint, kansas state maps, delaware state map, montana state maps, maryland state maps, us state maps, available interactive flash maps, city county databases, hawaii state maps. Innovative charts in Microsoft Excel. Excel & PowerPoint addin, geographical maps, thematic maps, interactive maps, dynamic infographics, month sales, gauges, meters, tachometer, tachymeter, thermometer, speedometer. Shape dynamically driven by Excel cells. Sparklines, mini column graphs, linechart, cascade, area graph, generate graphics, visualizing large quantity of data. Concise reports, intuitive Excel add-in, densified information, dashboard reporting, trends and exceptions. Office suite & tools. Great tool for making charts and graphs, chart generator.
With this Excel add-in you will be able to: transforms your data charts into enjoyable and captivating communication, Copy and paste format from a chart to another. Data charts don't have to be plain and austere, they can be interactive experiences with attractive visuals, animationis an add-in for Microsoft Office that lets you create your own spark lines in Excel, PowerPoint, Word, and HTML documents, easy-to-use software for creating business charts and diagrams, Accounting Software, Business Drawing Software, Certificate Creating Software, CAD Drawing Software, Floor Plan Software & Flowchart Software, attractive graphs excel, BeGraphic builds Wow Chart as the quick way to get spectacular animated bar charts in PowerPoint or Excel. Wow Chart made by BeGraphic produces awesome charts, for better impact, So you can make flashy chart with attractive animation effects and based on excel data, easily creating and maintaining org charts using Word, Excel, ... you to create animated, compact, interactive and attractive charts