Do you want to create thematic maps in Excel and PowerPoint?
BeGraphic has a free version to build your custom map and geographical dashboard based on live data.
With BeGraphic, not only you can make your own editable map, but you can also build custom sales territory map.
History of choropleth maps
When was invented the tinted map? This colourful name is the exact title given by French Baron Pierre Charles Dupin in 1826 to his new type of map showing the "Forces productives et commerciales de la France".
The terminology "choropleth map" came later, introduced by the American geographer John Kirtland Wright (1938: "Problems in Population Mapping"). Then came other designations: "intensity map", "thematic map" (with customized editable maps), "dynamic map".
How to make your own map in Microsoft Excel and PowerPoint
A) You need on your PC:
- Excel - any version from 2000 to 2010
(PowerPoint is optional) - BeGraphic (add-in for Excel)
You can install at zero cost the version Lite of BeGraphic. To download it, please click here
More than 1 000 organizations, such as NASA, General Motors, US Navy, United Nations, Siemens... already did it.
B) Inside BeGraphic, the very first function (on the left) is to build maps in Excel.
- Check if BeGraphic has the map you need inside its map library (by using the "Geographical map" function inside BeGraphic ribbon)
- If the map you need is not inside our free library, here are 3 solutions
- Look on the web for "vector maps" (in WMF or EMF formats). Many web sites give them for free under the name of "ClipArt".
Download using WMF format and put them in C:\Program Files\BeGraphic\BeGraphic\Content\Maps. - Make your own map by drawing freeform on top of images you want (using the Drawing toolbar as if it was tracing paper).
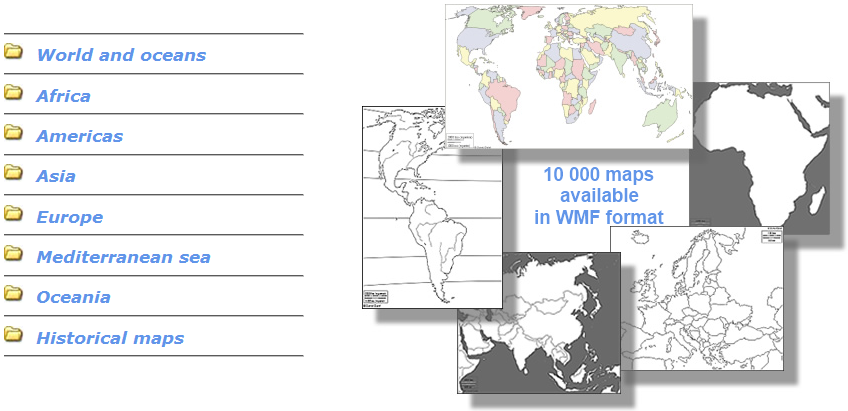
(How to videos : here, here & here) - 10 000 maps can be downloaded for free. But as too many people sent us mails to ask them, we only reply to business mails.
Download using WMF format and put them in C:\Program Files\BeGraphic\BeGraphic\Content\Maps.
To request us 10 000 blank maps and outlines, send us a mail to
- Look on the web for "vector maps" (in WMF or EMF formats). Many web sites give them for free under the name of "ClipArt".
C) Prepare your data inside Excel
- Put your data inside the table.
If you have too many values, you may have to make a discretization of your data by formulas such as:
"if the value is between 1 and 19, put 10" or Round / Mround functions (Excel functions). - Use cell-based conditional formatting (no range-based).
D) Set up BeGraphic
- Select the shape (FreeForm, AutoShape, Picture...)
- Make a right-click on the shape to access the "Set parameters" function.
Only in Excel version 2007 : To find the "Set parameters" function, please use its button in the middle of the ribbon. - Choose the cell(s) that will control the animation of the shape. Indeed BeGraphic will duplicates the cell's format on the shape's one.
You can see the how-to tutorial video of this example here.
E) Options : Put dynamic details
- Adding text on the custom map:
Inside Excel (same for PowerPoint), you can't directly add text (e.g.: Country name) inside FreeForms. That's because Microsoft blocked this option out of AutoShapes. Therefore you have to add a new TextBox in front of the map. Even if it sounds difficult, it is easier because you can put the text at the exact position you want. Of course you can make BeGraphic animate the TextBox the same way as the outline. - Changing the color of the border:
To make BeGraphic change the border of a country (format : color and size), you have to set up the parameter of the shape defining the "source cell". By doing so, BeGraphic will replicate the format of the upper border of the source cell on the format the country's frontier.
Be careful: if you change the format of the lower side of the top cell, it will change the upper side of the bottom cell. - To plot locations of the map, you have to do a manual work, point after point (e.g.: cities). No automatic plotting exists in BeGraphic because we don't know which scale, datum and projection your map is based on (Google maps can do it because its algorithm focuses on one single type of map based on the most popular projection, called WGS84 used by GPS).
- Needing to add VBA macro? No, BeGraphic doesn't need Visual Basic (VBA) to make dynamic maps. But as our thematic maps are pure Microsoft Excel, you could also use them with your own macros.
Example of a thematic map in Excel
- You can see the how-to tutorial video of this example here.
- To use and/or modify this example
- Inside the BeGraphic ribbon, click on the last button called "Example and Help" to reach the demo collection.
- In the first sub-menu "Example of usage", pick the "United Kingdom demo" map.
Other data visualizations
Your last questions might be about benchmarking BeGraphic with other simple GIS tools (Geographical Information System), such as "Data Map" in Excel 2000, MapPoint, Google Maps, Google Intensity map, Geo map, Solap (Spatial Olap), GeoQlik (not free QlikView add-on), interactive map alerts and map components (Xcelsius) or Dundas maps (Reporting Services).
The answer is simple: BeGraphic offers simplicity being 100% pure Microsoft Office! There is no training needed to build a customized map, nor additional software to read the map. On top of that, BeGraphic has 10 000 maps and can work with any plan you can draw up by yourself.
The version Lite of BeGraphic (may be the most powerful data visualization add-on for PowerPoint and Excel) gives you also for free 3 other advanced charts and graphics:
- gauges and meters (video : here)
- the largest collection of sparklines. No other software has such a range or micro-charts.
- any custom infographics (making any picture alive - changing the color, border... depending on live data)